|
This is a guest post by R. Tyler Croy, who is a long-time contributor to Jenkins and the primary contact for Jenkins project infrastructure. He is also a Jenkins Evangelist at CloudBees, Inc. |
For ages I have used the "Build After" feature in Jenkins to cobble together what one might refer to as a "pipeline" of sorts. The Jenkins project itself, a major consumer of Jenkins, has used these daisy-chained Freestyle jobs to drive a myriad of delivery pipelines in our infrastructure.
One such "pipeline" helped drive the complex process of generating the pretty blue charts on stats.jenkins.io. This statistics generation process primarily performs two major tasks, on rather large sets of data:
-
Generate aggregate monthly "census data."
-
Process the census data and create trend charts
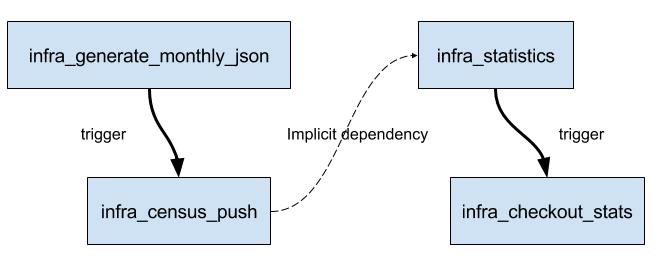
The chained jobs allowed us to resume the independent stages of the pipeline, and allowed us to run different stages on different hardware (different capabilities) as needed. Below is a diagram of what this looked like:

The infra_generate_monthly_json would run periodically creating the
aggregated census data, which would then be picked up by infra_census_push
whose sole responsibility was to take census data and publish it to the
necessary hosts inside the project’s infrastructure.
The second, semi-independent, "pipeline" would also run periodically. The
infra_statistics job’s responsibility was to use the census data, pushed
earlier by infra_census_push, to generate the myriad of pretty blue charts
before triggering the
infra_checkout_stats job which would make sure stats.jenkins.io was
properly updated.
Suffice it to say, this "pipeline" had grown organically over a period time when more advanced tools weren’t quite available.
When we migrated to newer infrastructure for ci.jenkins.io earlier this year I took the opportunity to do some cleaning up. Instead of migrating jobs verbatim, I pruned stale jobs and refactored a number of others into proper Pipelines, statistics generation being an obvious target!
Our requirements for statistics generation, in their most basic form, are:
-
Enable a sequence of dependent tasks to be executed as a logical group (a pipeline)
-
Enable executing those dependent tasks on various pieces of infrastructure which support different requirements
-
Actually generate those pretty blue charts
|
If you wish to skip ahead, you can jump straight to the Jenkinsfile which implements our new Pipeline. |
The first iteration of the Jenkinsfile simply defined the conceptual stages we
would need:
node {
    stage 'Sync raw data and census files'

    stage 'Process raw logs'

    stage 'Generate census data'

    stage 'Generate stats'

    stage 'Publish census'

    stage 'Publish stats'
}
How exciting! Although not terrifically useful. When I began actually implementing the first couple stages, I noticed that the Pipeline might sync dozens of gigabytes of data every time it ran on a new agent in the cluster. While this problem will soon be solved by the External Workspace Manager plugin, which is currently being developed. Until it’s ready, I chose to mitigate the issue by pinning the execution to a consistent agent.
/* `census` is a node label for a single machine, ideally, which will be
 * consistently used for processing usage statistics and generating census data
 */
node('census && docker') {
    /* .. */
}
Restricting a workload which previously used multiple agents to a single one introduced the next challenge. As an infrastructure administrator, technically speaking, I could just install all the system dependencies that I want on this one special Jenkins agent. But what kind of example would that be setting!
The statistics generation process requires:
Fortunately, with Pipeline we have a couple of useful features at our disposal: tool auto-installers and the CloudBees Docker Pipeline plugin.
Tool Auto-Installers
Tool Auto-Installers are exposed in Pipeline through the tool step and on
ci.jenkins.io we already had JDK8 and Groovy
available. This meant that the Jenkinsfile would invoke tool and Pipeline
would automatically install the desired tool on the agent executing the current
Pipeline steps.
The tool step does not modify the PATH environment variable, so it’s usually
used in conjunction with the withEnv step, for example:
node('census && docker') {
    /* .. */

    def javaHome = tool(name: 'jdk8')
    def groovyHome = tool(name: 'groovy')

    /* Set up environment variables for re-using our auto-installed tools */
    def customEnv = [
        "PATH+JDK=${javaHome}/bin",
        "PATH+GROOVY=${groovyHome}/bin",
        "JAVA_HOME=${javaHome}",
    ]

    /* use our auto-installed tools */
    withEnv(customEnv) {
        sh 'java --version'
    }

    /* .. */
}
CloudBees Docker Pipeline plugin
Satisfying the MongoDB dependency would still be tricky. If I caved in and installed MongoDB on a single unicorn agent in the cluster, what could I say the next time somebody asked for a special, one-off, piece of software installed on our Jenkins build agents?
After doing my usual complaining and whining, I discovered that the CloudBees
Docker Pipeline plugin provides the ability to run containers inside of a
Jenkinsfile. To make things even better, there are
official MongoDB docker images readily
available on DockerHub!
This feature requires that the machine has a running Docker daemon which is accessible to the user running the Jenkins agent. After that, running a container in the background is easy, for example:
node('census && docker') {
    /* .. */

    /* Run MongoDB in the background, mapping its port 27017 to our host's port
     * 27017 so our script can talk to it, then execute our Groovy script with
     * tools from our `customEnv`
     */
    docker.image('mongo:2').withRun('-p 27017:27017') { container ->
        withEnv(customEnv) {
            sh "groovy parseUsage.groovy --logs ${usagestats_dir} --output ${census_dir} --incremental"
        }
    }

    /* .. */
}
The beauty, to me, of this example is that you can pass a
closure to withRun which will
execute while the container is running. When the closure is finished executin,
just the sh step in this case, the container is destroyed.
With that system requirement satisfied, the rest of the stages of the Pipeline fell into place. We now have a single source of truth, the Jenkinsfile, for the sequence of dependent tasks which need to be executed, accounting for variations in systems requirements, and it actually generates those pretty blue charts!
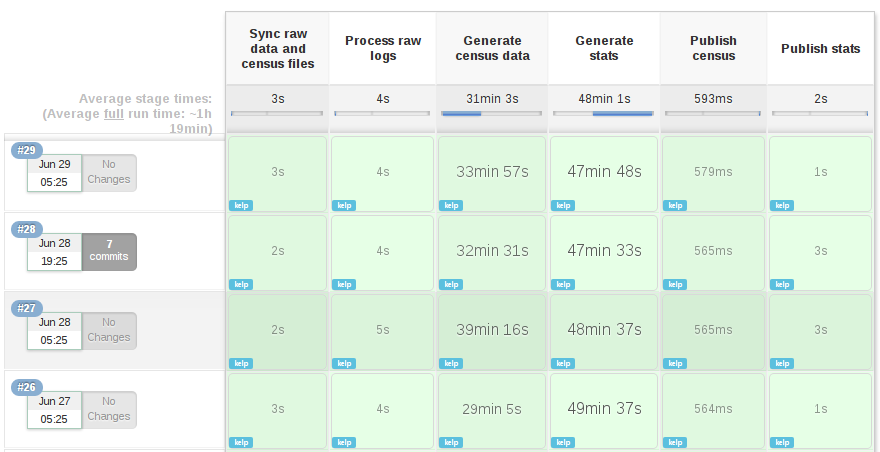
Of course, a nice added bonus is the beautiful visualization of our new Pipeline!
